


Adding Logging and Metrics to a Java REST API
Using Log4j v2 and Prometheus


Introduction
This post is a follow-up to the last two tutorials for building a Java REST API (Task Management Service) and integrating it with a MongoDB database:
https://blog.teonisoftware.com/step-by-step-tutorial-for-building-a-rest-api-in-java
https://blog.teonisoftware.com/integrating-a-java-rest-api-with-a-database
I've decided to add logging and monitoring functionalities to be able to track the performance of the API. Metrics and logs are two critical parts of achieving operational stability for a given software service. While they serve slightly different purposes and can be used independently, it's usually the combination of the two that gives the greatest benefit when it comes to preventing, troubleshooting and resolving service outages. In this tutorial, we are going to use:
Log4j2 - a Java software framework that alleviates the process of adding logging functionality in a given piece of software
Prometheus - a set of applications used for storing, querying and visualizing real-time metrics
Current State
In the current setup, the local deployment consists of two containers:
one for running the service for managing TODO/task items
one for running the Mongo DB instance used as the storage mechanism for the API
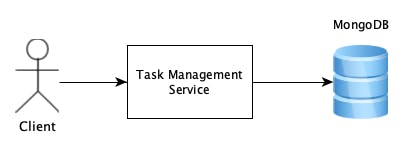
Docker is used as the container runtime environment and docker-compose is used to orchestrate the multi-container deployment.
Target State
What we want to achieve at the end of this tutorial is the diagram below. The green colour is used to indicate a new component or piece of software.
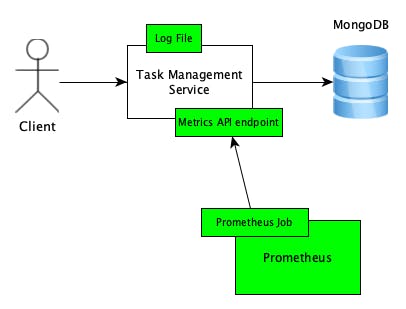
As we can see, there are 3 major changes:
A log file where the Task Management Service is going to write information about events, e.g. whenever a new request was processed
A new API endpoint that will expose Prometheus-format metrics indicating the performance of the Task Management Service, e.g. request latency (how much time it took the service to process a given request)
A new container that runs the Prometheus server as well as a Prometheus Job that periodically pulls metrics from the Task Management Service
Adding Logs
We start this tutorial by adding logs to the API.
Configuring Log4j2
The first step is to add Log4j as a dependency in the Maven POM file (notice that we are using Log4j v2 which is why this post is referring to Log4j2 instead of its predecessor library Log4j):
  <dependencies>
    ...
    <dependency>
      <groupId>org.apache.logging.log4j</groupId>
      <artifactId>log4j-api</artifactId>
      <version>2.13.0</version>
    </dependency>
    <dependency>
      <groupId>org.apache.logging.log4j</groupId>
      <artifactId>log4j-core</artifactId>
      <version>2.13.0</version>
    </dependency>
    ...
  </dependencies>
We also need a special log4j2 properties file which the framework uses to configure the logger instance we need. For this service, we use a very simple config which creates a logger that writes the messages to a file. Since this is not a Log4j-specific tutorial, for details about the config syntax or semantics please refer to the official Log4j documentation
# logging level and dest for internal events within log4j2
status = error
dest = err
# config name
name = ServiceLogConfig

# file appender
appender.file.type = File
appender.file.name = FileLog
appender.file.fileName = /var/log/task-management-service/service.log
appender.file.layout.type = PatternLayout
appender.file.layout.pattern = %d %p %C [%t] %m%n

# service-specific logger (the name should be the root package path of all classes that will use this logger)
logger.service.name = taskmanagement
logger.service.level = info
# linking the service-specific logger to the file appender
logger.service.appenderRefs = file
logger.service.appenderRef.file.ref = FileLog
The full commit for this step can be found here.
Writing logs
Now that we have Log4j2 configured we can start logging messages from within the service. For example, we can override the `toString()` method of the Task class and log a message whenever a new task is created that would show us the auto-generated ID of the new task:
public class Task {
    ...
    @Override
    public String toString() {
        return "Task{" +
                "identifier='" + identifier + '\'' +
                ", title='" + title + '\'' +
                ", description='" + description + '\'' +
                ", createdAt=" + createdAt +
                ", completed=" + completed +
                '}';
    }
    ...
}
public class TaskManagementService {

    // get a logger instance for this class
    private static final Logger LOGGER = LogManager.getLogger(TaskManagementService.class);

    ...

    public Task create(String title, String description)  {
        Task task = Task.builder(title, description).build();

        repository.save(task);

        // log an info message for each new task that was created
        LOGGER.info("Successfully created new task {}", task);

        return task;
    }
...
}
The full commit for this step can be found here.
Another useful thing we can log is a message for each new API request that is sent to the service - the message will contain the request method, the request URI, the response status code and the processing time of the request. To achieve this, we need a LoggingFilter class that implements both the container request filter interface and the container response filter interface:
@Provider
@PreMatching
public class LoggingFilter implements ContainerRequestFilter, ContainerResponseFilter {

    private static final Logger LOGGER = LogManager.getLogger(LoggingFilter.class);

    @Override
    public void filter(ContainerRequestContext requestContext) {
        long processingStartTime = Instant.now().toEpochMilli();
        requestContext.setProperty("requestProcessingStartTime", processingStartTime);
    }

    @Override
    public void filter(ContainerRequestContext requestContext, ContainerResponseContext responseContext) {
        long processingStartTime = (long) requestContext.getProperty("requestProcessingStartTime");
        long processingEndTime = Instant.now().toEpochMilli();
        long processingLatency = processingEndTime - processingStartTime;

        LOGGER.info("{} {} {} {}ms",
                requestContext.getMethod(),
                requestContext.getUriInfo().getRequestUri().getPath(),
                responseContext.getStatus(),
                processingLatency);
    }
}
The first filter method captures the request before it has been processed by a resource class and records the request processing start time. The second filter method captures the request after it has been processed and calculates how many milliseconds it took the service to process the request. It is important to note that we use the @PreMatching annotation to ensure that the filter is executed even when the Jersey framework doesn't find an appropriate resource class that corresponds to the request URI (i.e. whenever we have a 404 response from the service). As with other provider classes we used in the previous tutorials, we bind the LoggingFilter in the application config:
@ApplicationPath("/api")
public class ApplicationConfig extends ResourceConfig {

    @Inject
    public ApplicationConfig(ServiceLocator serviceLocator) {
        ...
        register(LoggingFilter.class);
        ...
    }

}
The full commit for this step can be found here.
Inspecting Logs
To test that the service is logging messages, we can inspect the log file we configured in the log4j2 config file. First, we start the local deployment of the application and send a couple of test requests to create new tasks.
docker-compose up --build -d

curl -i -X POST -H "Content-Type:application/json" -d "{\"title\": \"test-title-1\", \"description\":\"description\"}" "http://localhost:8080/api/tasks"
HTTP/1.1 201
Location: http://localhost:8080/api/tasks/9e3ce938-1206-480d-b84a-0f782eaeb0b4
Content-Length: 0
Date: Sat, 17 Dec 2022 10:46:57 GMT

curl -i -X POST -H "Content-Type:application/json" -d "{\"title\": \"test-title-2\", \"description\":\"description\"}" "http://localhost:8080/api/tasks"
HTTP/1.1 201
Location: http://localhost:8080/api/tasks/ccdc375a-a278-4416-826d-62cbbd723b42
Content-Length: 0
Date: Sat, 17 Dec 2022 10:47:09 GMT
Then, we inspect the log file in the docker container using the docker exec command.
docker exec -t taskmanagementservice_api sh -c "cat /var/log/task-management-service/service.log"

2022-12-17 10:46:57,143 INFO taskmanagement.service.TaskManagementService [http-nio-8080-exec-1] Successfully created new task Task{identifier='9e3ce938-1206-480d-b84a-0f782eaeb0b4', title='test-title-1', description='description', createdAt=2022-12-17T10:46:57.100681Z, completed=false}

2022-12-17 10:46:57,156 INFO taskmanagement.api.LoggingFilter [http-nio-8080-exec-1] POST /api/tasks 201 164ms

2022-12-17 10:47:09,249 INFO taskmanagement.service.TaskManagementService [http-nio-8080-exec-3] Successfully created new task Task{identifier='ccdc375a-a278-4416-826d-62cbbd723b42', title='test-title-2', description='description', createdAt=2022-12-17T10:47:09.244510Z, completed=false}

2022-12-17 10:47:09,250 INFO taskmanagement.api.LoggingFilter [http-nio-8080-exec-3] POST /api/tasks 201 8ms
As we can see, for each request we have two messages:
one from the TaskManagementService class which indicates the creation of a new task
one from the LoggingFilter showing the response status code and request processing time
Adding Metrics
The next topic of this tutorial is adding metrics to our API. This is a more complex topic, but I tried to bring it down to a few small and easily digestible steps.
Now some background information on Prometheus. It consists of many components of which a major one is the Prometheus server. This component is responsible for scraping, storing and querying the metrics data. For this tutorial, we are going to run the Prometheus server inside a new Docker container. When it comes to metrics data collection, Prometheus follows an HTTP pull model or in other words, the Prometheus server periodically queries other applications for their metrics data. On a high level, this is how it works:
We configure jobs on the Prometheus server.
Each job is responsible for collecting the metrics from a particular piece of software (e.g. Nginx)
Each job can query multiple targets (e.g. multiple hosts running Nginx)
The query itself represents a GET HTTP call to each target using the URL path
/metrics(this is configurable and can be changed for individual jobs)If needed different authorization mechanisms can be used in the HTTP call - e.g. providing a Bearer token
For more Prometheus-specific information, please refer to the overview documentation.
Prometheus Container Setup
The first step for integration with Prometheus is to include a Prometheus container in the docker-compose deployment file:
  prometheus:
    image: "prom/prometheus:v2.40.7"
    container_name: taskmanagementservice_prometheus
    volumes:
      - .data/prometheus:/prometheus
      - ./prometheus.yml:/etc/prometheus/prometheus.yml
    ports:
      - "9090:9090"
Two key points in the configuration above:
We mount a persistent volume to the Prometheus container so that metrics are not lost when the container crashes or is restarted - any data stored in
/prometheus(default location where Prometheus stores data) on the container will be stored under.data/prometheus(relative to the project root folder) on your local machine.We do the same for the
prometheus.ymlconfig file./etc/prometheus/prometheus.ymlis the default location where the Prometheus server will look for a configuration file on startup.
As for the Prometheus config file itself, for now, we are going to use a very simple config that instructs Prometheus to scrape itself (this means it will query its own /metrics API endpoint). The scrape interval for all jobs is set to 15 seconds.
global:
  scrape_interval: 15s

scrape_configs:
  - job_name: 'prometheus'

    static_configs:
      - targets: ['localhost:9090']
The full commit for this step can be found here.
Visualizing Prometheus Metrics
In a production environment, most likely we would have been using a more advanced dashboarding solution (e.g. Grafana) to visualize metrics. However, in this case, we are going to use the Prometheus server built-in expression browser. One metric that Prometheus exposes about itself is called prometheus_http_requests_total and it represents a counter of the number of HTTP requests sent to the Prometheus server broken down by status code, URL path, etc. An example graph for this metric can be seen by visiting this URL in your browser (assuming the local deployment is up and running).
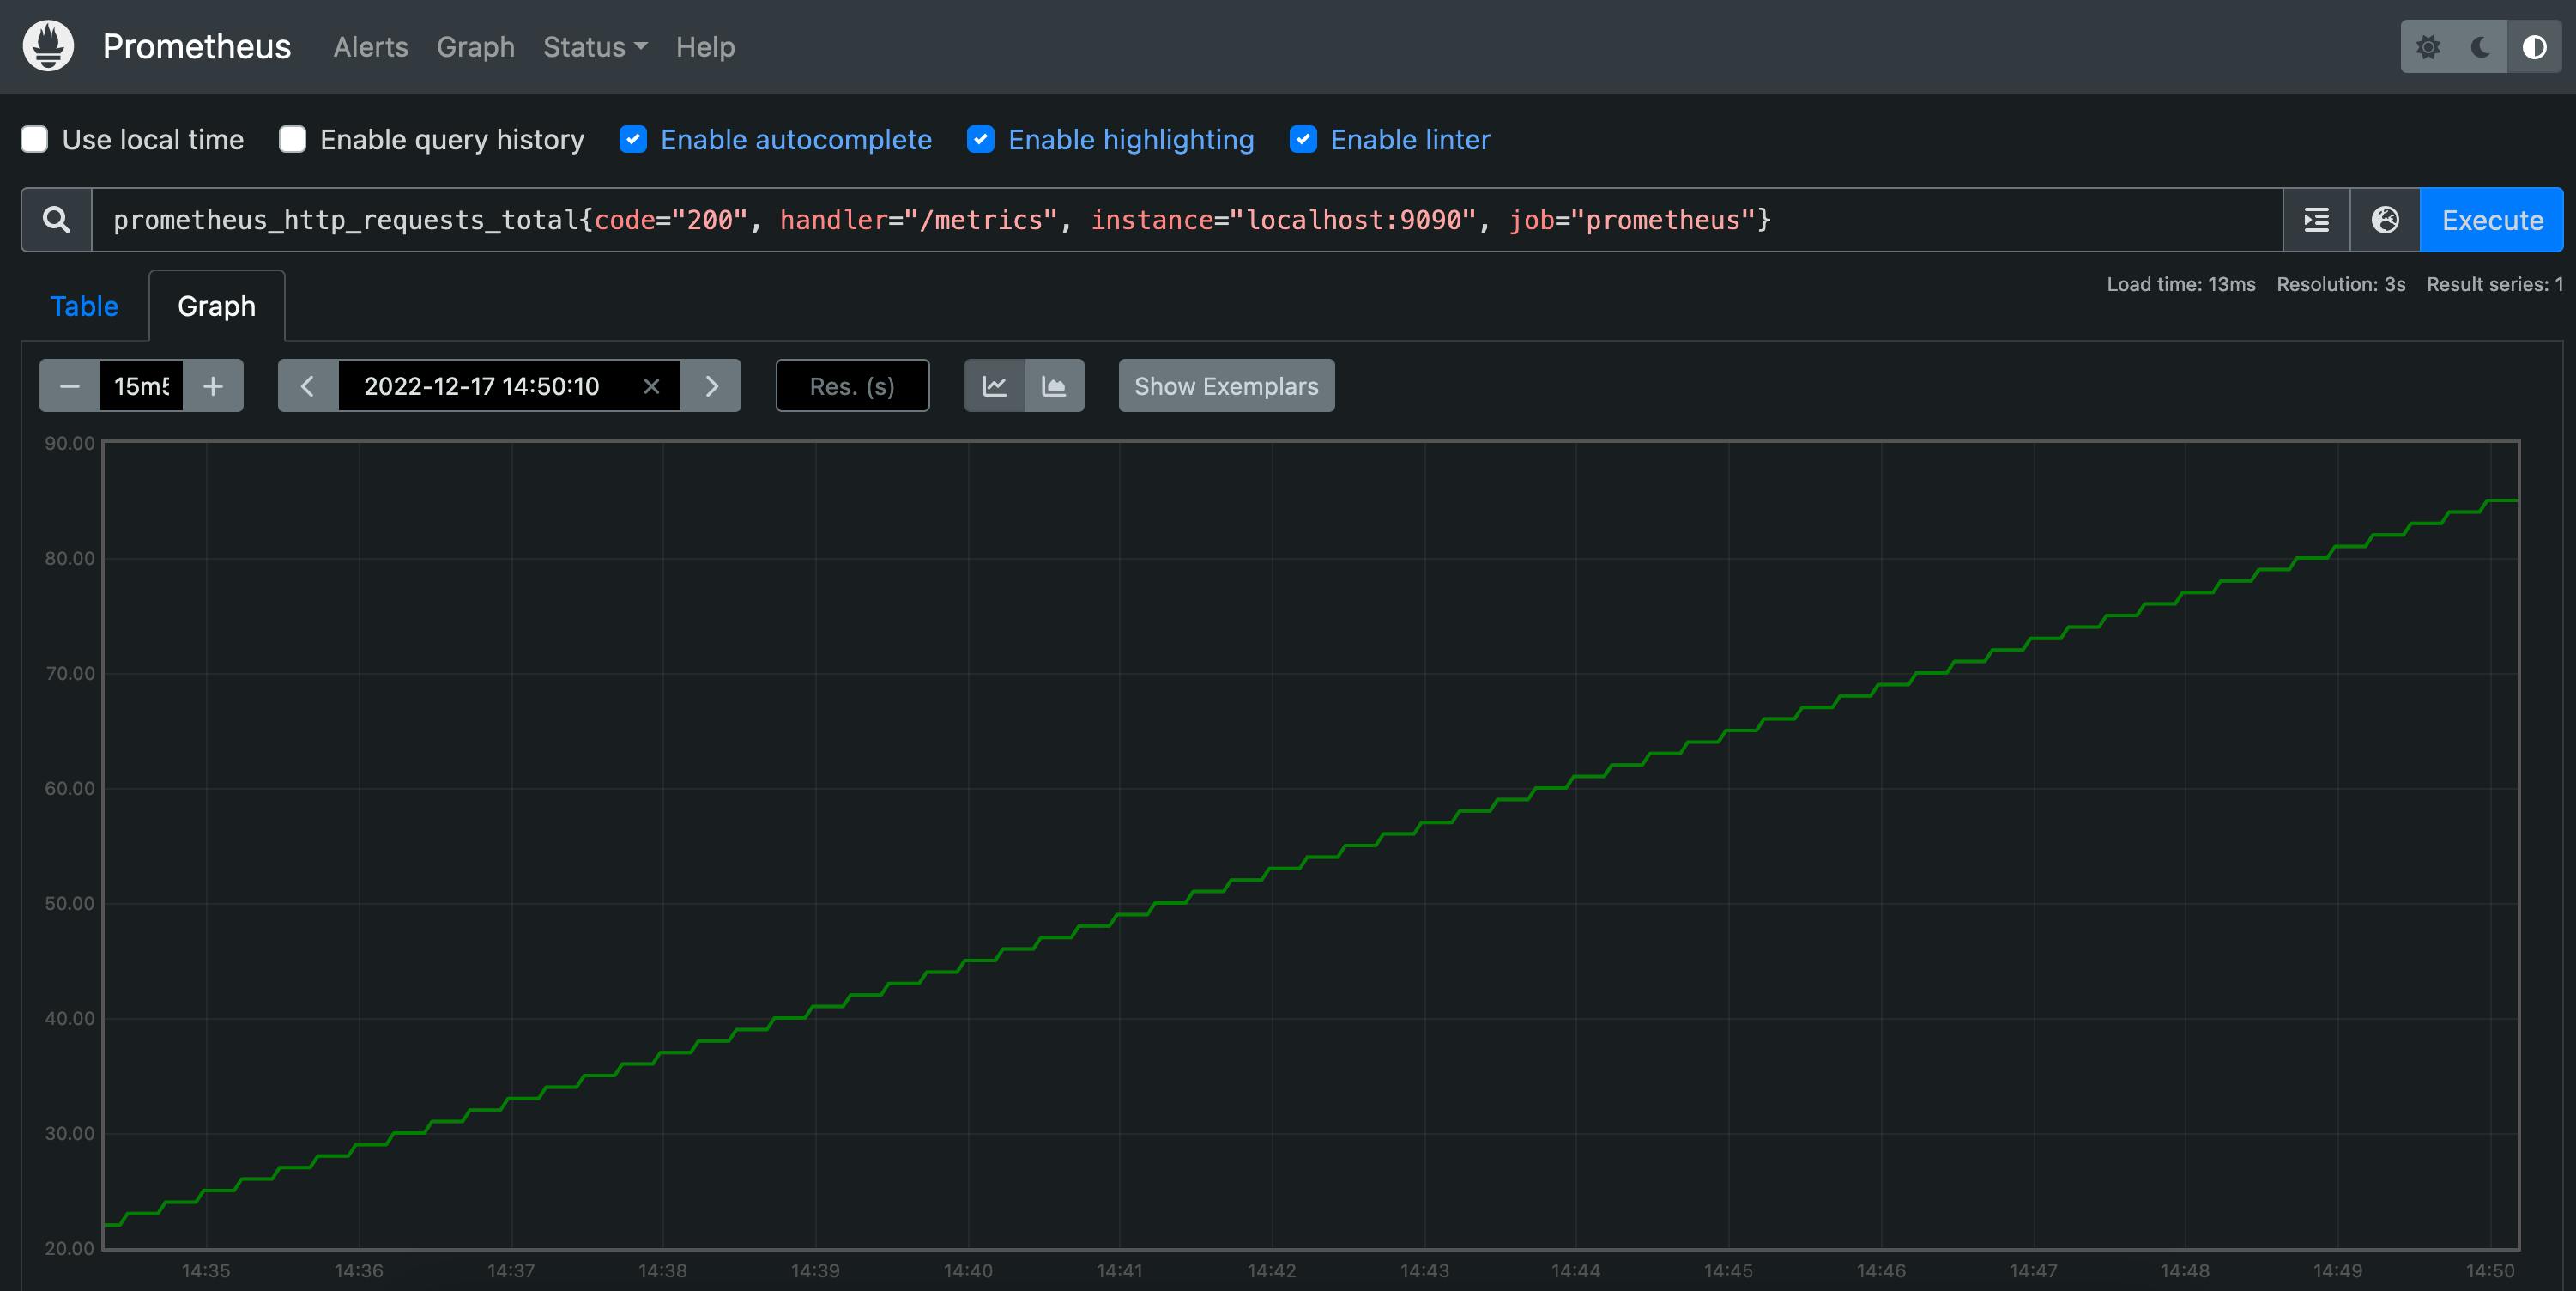
What this graph represents is the counter for successful requests sent to the /metrics URL path. As expected, this is a continuously increasing graph because the metrics endpoint is continuously queried by the job we configured for collecting metrics from the Prometheus server itself.
Implementing Service Metrics API Endpoint
The next step is to implement a metrics API endpoint in the Task Management Service. This endpoint will be queried by a Prometheus metrics collection job that we will configure later.
We start by adding a dependency in the POM file for the Prometheus client library:
  <dependencies>
    ...
    <dependency>
      <groupId>io.prometheus</groupId>
      <artifactId>simpleclient_httpserver</artifactId>
      <version>0.16.0</version>
    </dependency>
    ...
  </dependencies>
Then, we implement the metrics API resource class:
@Path("/metrics")
public class MetricsResource {

    @GET
    @Produces(MediaType.TEXT_PLAIN)
    public String metrics() throws IOException {
        StringWriter writer = new StringWriter();

        TextFormat.write004(writer, CollectorRegistry.defaultRegistry.metricFamilySamples());

        return writer.toString();
    }

}
It is worth mentioning that throughout this implementation we are going to use the default metrics collectors registry which is sufficient for our use case and also makes the implementation much simpler. As we can see in the code above, the implementation of the endpoint is simply calling a method on the default registry and returning the response as plain text. The Prometheus client library outputs the response in the format expected by the Prometheus server job. (We will see what the format looks like during testing).
Next, we implement the metrics filter (the class responsible for populating metrics in the default registry), but before that, we need to make two small changes in the logging filter we implemented earlier:
adding a priority annotation to define the order in which the filters are executed (the lower the number, the higher the priority)
setting a request context property -
requestProcessingTime- to preserve the request processing time so that it can also be used in the metrics filter
@Priority(2)
@Provider
@PreMatching
public class LoggingFilter implements ContainerRequestFilter, ContainerResponseFilter {
    ...
    @Override
    public void filter(ContainerRequestContext requestContext, ContainerResponseContext responseContext) {
        ...
        // save the request processing time so that it can be used in the metrics filter
        requestContext.setProperty("requestProcessingTime", processingLatency);
        ...
    }
}
As for the metrics filter, this is what it looks like:
@Priority(1)
@Provider
public class MetricsFilter implements ContainerResponseFilter {

    private static final String[] LABELS = new String[]{
            "requestMethod",
            "uriPath",
            "responseCode"
    };

    private static final Histogram requestLatencyHistogram = Histogram.build()
            .name("task_management_service_requests_latency")
            .labelNames(LABELS)
            .buckets(5, 25, 50, 75, 100, 500, 1000, 5000, 10000)
            .help("Request latency in milli-seconds.")
            .register();

    @Override
    public void filter(ContainerRequestContext requestContext, ContainerResponseContext responseContext) {
        String[] labelsValues = new String[3];

        String requestMethod = requestContext.getMethod();
        labelsValues[0] = requestMethod;

        String uriPath = requestContext.getUriInfo().getRequestUri().getPath();
        labelsValues[1] = uriPath;

        int responseCode = responseContext.getStatus();
        labelsValues[2] = Integer.toString(responseCode);

        long processingTime = (long) requestContext.getProperty("requestProcessingTime");

        requestLatencyHistogram
                .labels(labelsValues)
                .observe(processingTime);
    }
}
Key points here are:
We use priority with value 1 which is less than the value of the logging filter priority - what this means is that the order of execution would be the following:
request filter method from MetricsFilter class (if one exists, in our case there isn't one)
request filter method from LoggingFilter class
response filter method from LoggingFilter class
response filter method from MetricsFilter class
We rely on the fact that the logging filter's execution was successful so that the request processing time property can be extracted from the request context
We use a histogram registered in the default registry to collect the latency metric - for more information on histograms, refer to the documentation
Finally, we need to register both the MetricsFilter class and the MetricsResource class in the application API config:
@ApplicationPath("/api")
public class ApplicationConfig extends ResourceConfig {

    @Inject
    public ApplicationConfig(ServiceLocator serviceLocator) {
        ...
        register(MetricsResource.class);
        ...
        register(MetricsFilter.class);
        ...
    }

}
Now, we can test the new endpoint using curl. For a fresh deployment, the first time we query the endpoint we get this response:
curl -i -X GET  "http://localhost:8080/api/metrics"
HTTP/1.1 200
Content-Type: text/plain
Content-Length: 140
Date: Sat, 17 Dec 2022 17:10:02 GMT

# HELP task_management_service_requests_latency Request latency in milli-seconds.
# TYPE task_management_service_requests_latency histogram
This is because this request is the first one processed by the task management service. Therefore, no metrics have been collected yet. If we repeat the same request, we get the following:
curl -i -X GET  "http://localhost:8080/api/metrics"
HTTP/1.1 200
Content-Type: text/plain
Content-Length: 1918
Date: Sat, 17 Dec 2022 17:11:25 GMT

# HELP task_management_service_requests_latency Request latency in milli-seconds.
# TYPE task_management_service_requests_latency histogram
task_management_service_requests_latency_bucket{requestMethod="GET",uriPath="/api/metrics",responseCode="200",le="5.0",} 0.0
task_management_service_requests_latency_bucket{requestMethod="GET",uriPath="/api/metrics",responseCode="200",le="25.0",} 1.0
task_management_service_requests_latency_bucket{requestMethod="GET",uriPath="/api/metrics",responseCode="200",le="50.0",} 1.0
task_management_service_requests_latency_bucket{requestMethod="GET",uriPath="/api/metrics",responseCode="200",le="75.0",} 1.0
task_management_service_requests_latency_bucket{requestMethod="GET",uriPath="/api/metrics",responseCode="200",le="100.0",} 1.0
task_management_service_requests_latency_bucket{requestMethod="GET",uriPath="/api/metrics",responseCode="200",le="500.0",} 1.0
task_management_service_requests_latency_bucket{requestMethod="GET",uriPath="/api/metrics",responseCode="200",le="1000.0",} 1.0
task_management_service_requests_latency_bucket{requestMethod="GET",uriPath="/api/metrics",responseCode="200",le="5000.0",} 1.0
task_management_service_requests_latency_bucket{requestMethod="GET",uriPath="/api/metrics",responseCode="200",le="10000.0",} 1.0
task_management_service_requests_latency_bucket{requestMethod="GET",uriPath="/api/metrics",responseCode="200",le="+Inf",} 1.0
task_management_service_requests_latency_count{requestMethod="GET",uriPath="/api/metrics",responseCode="200",} 1.0
task_management_service_requests_latency_sum{requestMethod="GET",uriPath="/api/metrics",responseCode="200",} 7.0
# HELP task_management_service_requests_latency_created Request latency in milli-seconds.
# TYPE task_management_service_requests_latency_created gauge
task_management_service_requests_latency_created{requestMethod="GET",uriPath="/api/metrics",responseCode="200",} 1.671297002185E9
It's visible that this is a very robust response because of the multiple histogram buckets. However, all it is saying is that there was one processed request in total (the first curl request we sent) and it took 7ms to process it (the histogram works based on a list of buckets and a metric is recorded in all buckets with a value bigger than the metric value - that's why only the first bucket with value 5 still has a count of 0)
We can also confirm the above by looking at the log file again which shows that the request took 7ms to process:
docker exec -t taskmanagementservice_api sh -c "cat /var/log/task-management-service/service.log"
2022-12-17 17:10:02,182 INFO taskmanagement.api.LoggingFilter [http-nio-8080-exec-1] GET /api/metrics 200 7ms
Now we need to integrate Prometheus with this endpoint so that service metrics are continuously collected. This can be achieved by configuring a new job in the Prometheus config file:
...
scrape_configs:
  - job_name: 'task-management-service'

    metrics_path: /api/metrics

    static_configs:
      - targets: ['localhost:8080']
...
The full commit for this step can be found here.
Finally, we reset the deployment so that the new changes can take effect:
docker-compose down
docker-compose up --build -d
Visualizing Service Metrics
To see the service-specific metrics visualized in the Prometheus expression browser, we need to send a few test requests first:
curl -i -X POST -H "Content-Type:application/json" -d "{\"title\": \"test-title-1\", \"description\":\"description\"}" "http://localhost:8080/api/tasks"
HTTP/1.1 201
Location: http://localhost:8080/api/tasks/ae33f988-0260-498b-b9c6-51d52250ffce
Content-Length: 0
Date: Sat, 17 Dec 2022 17:56:46 GMT

curl -i -X GET "http://localhost:8080/api/tasks/ae33f988-0260-498b-b9c6-51d52250ffce"
HTTP/1.1 200
Content-Type: application/json
Content-Length: 161
Date: Sat, 17 Dec 2022 17:57:17 GMT

{"identifier":"ae33f988-0260-498b-b9c6-51d52250ffce","title":"test-title-1","description":"description","createdAt":"2022-12-17T17:56:46.856Z","completed":false}

curl -i -X POST -H "Content-Type:application/json" -d "{\"title\": \"test-title-1\", \"description\":\"description\"}" "http://localhost:8080/api/tasks"
HTTP/1.1 201
Location: http://localhost:8080/api/tasks/b373370c-1abe-410f-a646-d1bab895cd96
Content-Length: 0
Date: Sat, 17 Dec 2022 17:59:18 GMT

curl -i -X GET "http://localhost:8080/api/tasks/b373370c-1abe-410f-a646-d1bab895cd96"
HTTP/1.1 200
Content-Type: application/json
Content-Length: 161
Date: Sat, 17 Dec 2022 17:59:30 GMT

{"identifier":"b373370c-1abe-410f-a646-d1bab895cd96","title":"test-title-1","description":"description","createdAt":"2022-12-17T17:59:18.181Z","completed":false}
After waiting for a minute, we should be able to see the new metrics in the Prometheus expression browser by going to http://localhost:9090/graph and searching for the task_management_service_requests_latency_count metric. In the table view we can see the number of processed requests broken down by URI path, request method and response status code:
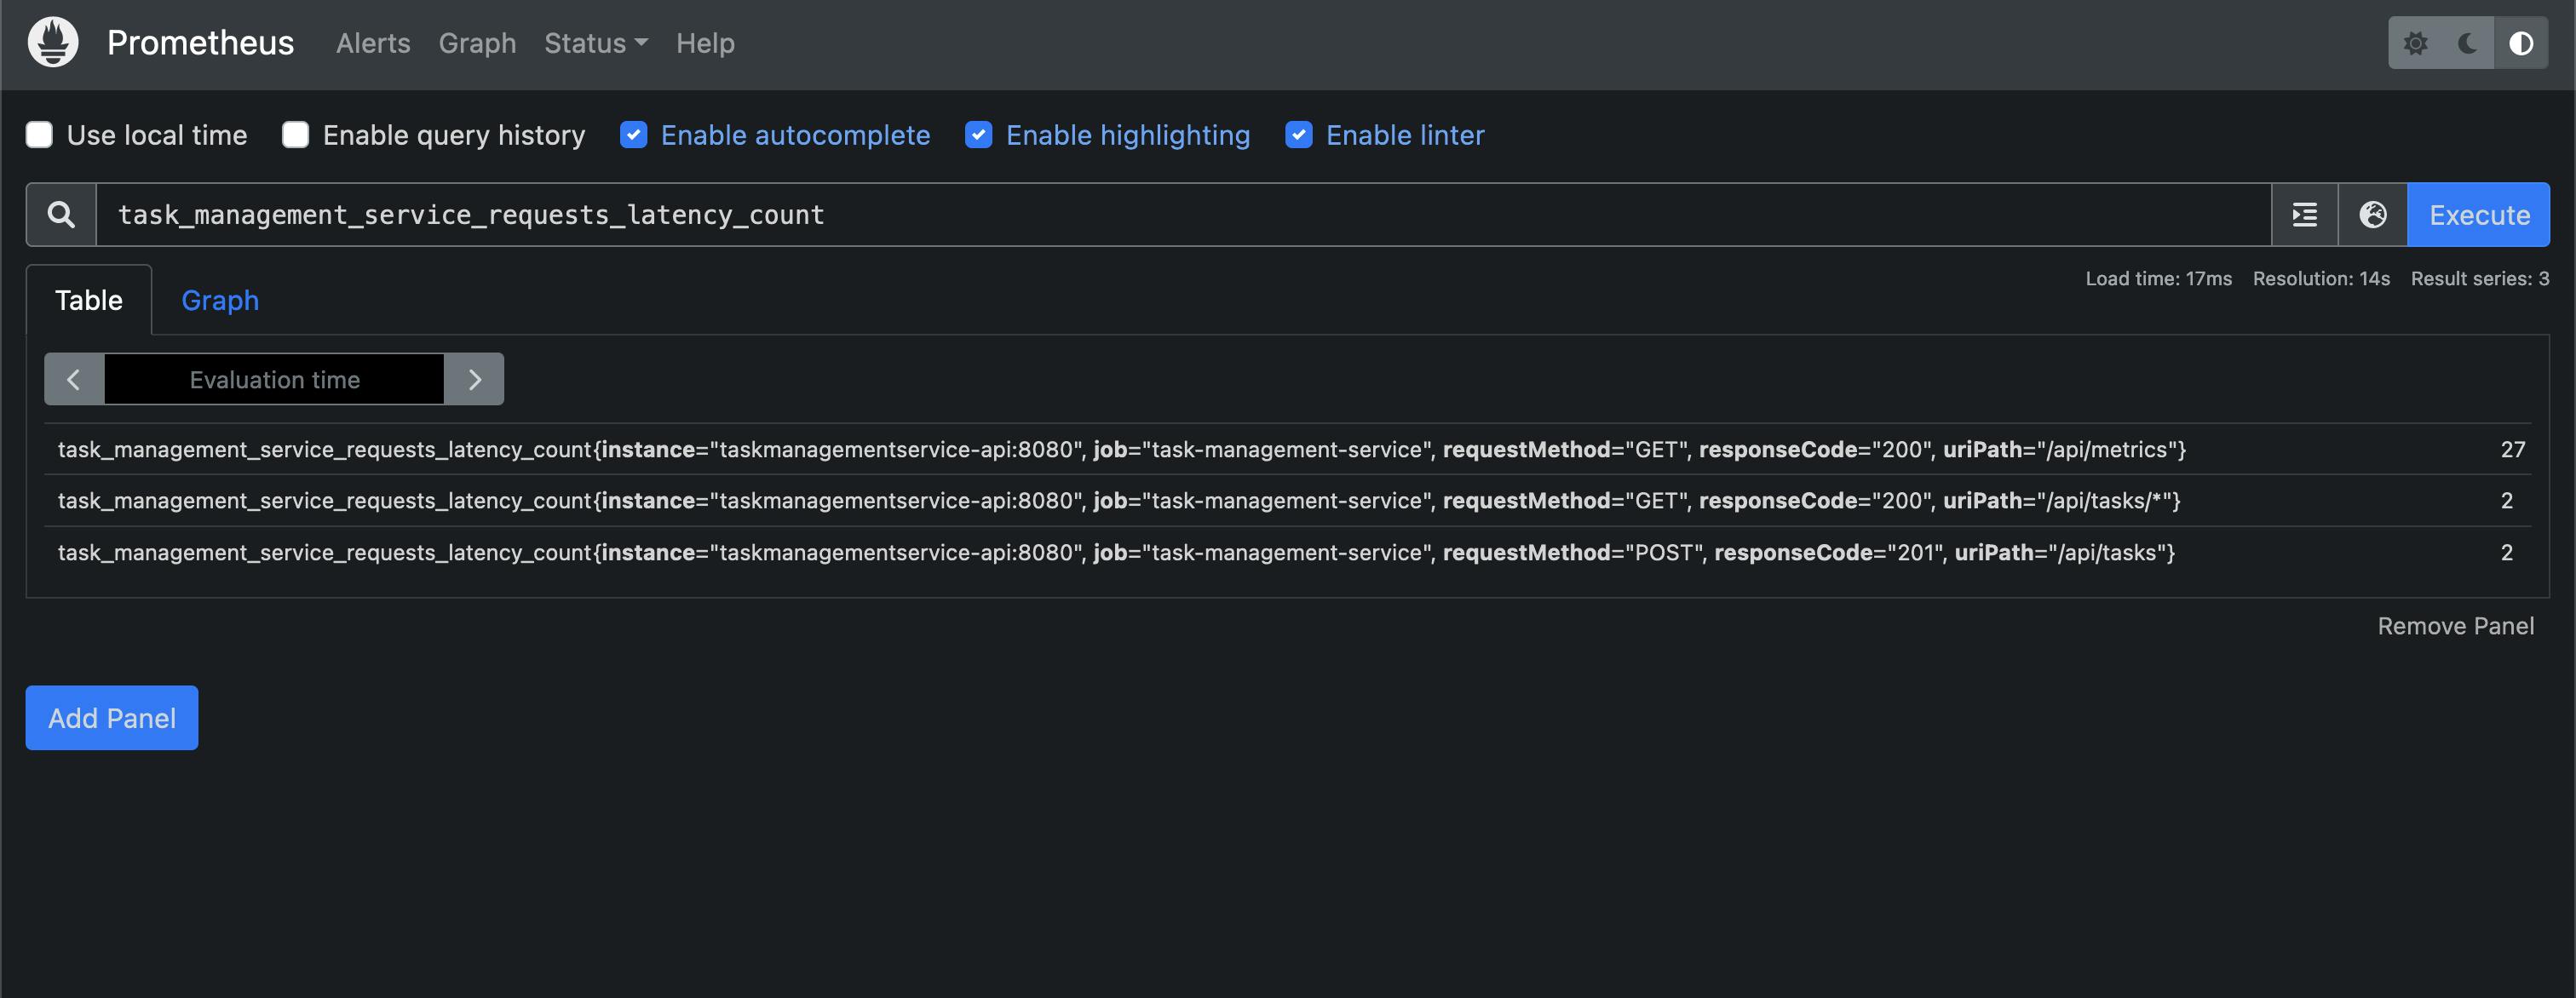
If you are interested in playing around with the new metric, in the Prometheus histograms documentation you will find other queries that can be used to produce valuable performance graphs.
Summary
In conclusion, as part of this tutorial, we have implemented two major operational stability improvements in the task management service API:
file-based logging functionality using log4j2 which helped us:
log a message whenever a new task is created so that we can easily find the auto-generated UUID for the new task
log a message whenever a new request is processed so that we can easily find the response code for the given request as well the time it took to process the request
metrics functionality using Prometheus which helped us:
- emit metrics for the latency and count of processed API requests broken down by URI path, request method and response status code
We also visualized the new metrics in the Prometheus expression browser. Ideally, we can integrate Grafana with Prometheus so that these metrics are included in a proper monitoring dashboard. Let me know if you would like to see a separate tutorial on this or if you have any questions regarding the topics explored in this blog post.